- Measure earned hours: the hours the estimate allowed for the work actually installed.
- Productivity factor = actual hours ÷ earned hours; 1.22 means 22% more hours than planned.
- A straight line assumes nothing improves; a model trained on past jobs learns how much does.
- Back-test any model on your own completed jobs before you trust it.
Measuring labor performance
Everything starts with earned hours: the hours the estimate allowed for the work actually installed. Compare them with the hours actually spent:
productivity factor = actual hours ÷ earned hours
A factor of 1.22 means crews are using 22% more hours than the estimate assumed for the same work. Measure it by cost code and crew, weekly — a job-wide monthly number hides where the hours go.
For more inputs, a second forecast and a shareable link: the labor burden & overtime calculator →
Three ways to forecast the remaining hours
| Method | Assumes | Weakness |
|---|---|---|
| Straight line | The productivity factor to date continues to the end. | Overstates overruns on jobs that improve, understates on jobs that get worse late. |
| Learning curve | Productivity improves with repetition (typical floors, units). | Needs a curve you trust; wrong on non-repetitive work. |
| Machine learning | Jobs like this one behave the way similar past jobs did. | Needs history, and must be back-tested and explainable. |
How a machine-learning labor forecast works
A forecast built from past jobs uses your completed jobs: for each, where the hours stood part-way through and where they finished. The model finds the pattern — for example, that multifamily framing crews running 20% over at a third complete typically recover about half of it, while healthcare fit-out crews recover little. For a live job it looks at the most similar past jobs (sector, size, trade mix, crew, early burn, change-order volume, weather days) and forecasts from how they actually finished, with a range.
The two forecasts are telling you different things about the same job — and the gap is worth several hundred thousand dollars in what you tell the owner. The demo’s labor view shows this calculation, the neighbouring jobs and the model’s inputs on sample data.
How to know which forecast to trust
- Back-test it. Re-run the forecast on each past job as of 25%, 50% and 75% complete, using only the other jobs, and measure the error. A model that cannot beat the straight line on your own history should not be used.
- Demand the working. Which past jobs, which features, what range. A number with no explanation will not survive a project review.
- Keep the humans in it. The PM knows about the resequencing next week. Use the model to challenge the PM’s projection, not to replace it.
Productivity from installed quantities
Hours alone say how much labor was spent, not how much work it bought. Installed quantities fix that:
Productivity factor = earned hours ÷ actual hours
Hours to complete = remaining quantity × actual hours per unit
| Drywall hang | Value |
|---|---|
| Budget: 48,000 SF at 0.020 hr/SF | 960 hours |
| Installed to date | 18,000 SF |
| Earned hours (18,000 × 0.020) | 360 hours |
| Actual hours | 414 hours |
| Productivity factor (360 ÷ 414) | 0.87 |
| Hours to complete at the actual rate (30,000 SF × 0.023) | 690 hours |
| Forecast total (414 + 690) | 1,104 hours — 144 over budget |
A factor below 1.0 is the early warning, weeks before the hours budget runs out.
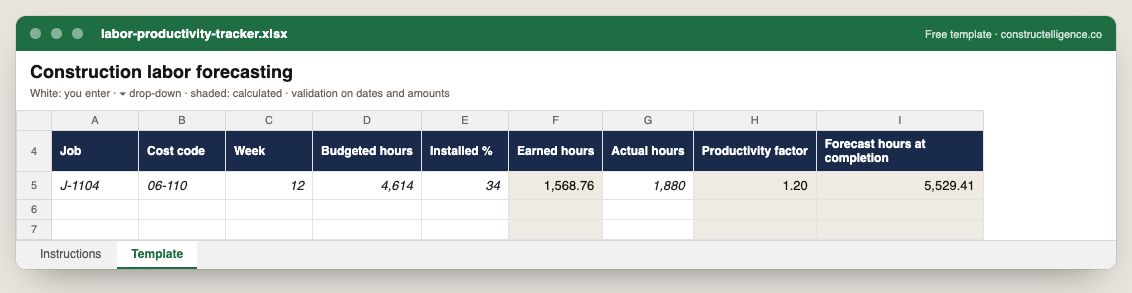
Weekly labor by cost code: budgeted hours and installed percent, with earned hours, productivity factor and forecast hours at completion calculated.
9 columns: 6 you fill in and 3 calculated by formula and filled down 200 rows, so nothing is worked out by hand. In the Excel version, 4 columns reject entries of the wrong type (a date column only takes dates, an amount column only numbers), the header row stays frozen with filters on it, and the workbook opens on an Instructions sheet that lists every column below.
Every column, and how it is captured
| Column | Type | What goes in it |
|---|---|---|
| Job | Text | Job number exactly as in your accounting system (e.g. J-1104), so rows join to job cost. |
| Cost code | Text | Cost code from your cost code list, matching the estimate and the ERP. |
| Week | Number | Week-ending date. |
| Budgeted hours | Number | Hours in the estimate for the line. |
| Installed % | Percent | Enter a percentage, 0–100. |
| Earned hours | Calculated | Calculated: [Budgeted hours] × [Installed %] ÷ 100 |
| Actual hours | Number | Hours charged to the line from timecards. |
| Productivity factor | Calculated | Calculated: [Actual hours] ÷ [Earned hours] |
| Forecast hours at completion | Calculated | Calculated: [Actual hours] + ([Budgeted hours] − [Earned hours]) × [Productivity factor] |
See it on real-looking numbers
Constructelligence is a construction intelligence platform: it reads your ERP, project and field systems read-only and does this arithmetic every week, for every job. The demo runs it on a sample eight-job portfolio.
Try the demoJoin the private betaFrequently asked questions
How do you forecast labor hours in construction?
Measure earned hours against actual hours to get a productivity factor, then forecast the remaining hours. The simplest method carries today's factor forward; better methods apply a learning curve or a model trained on how similar past jobs actually finished.
What is a labor productivity factor?
It is actual hours divided by earned hours — the hours the estimate allowed for the work installed. A factor above 1.0 means crews are using more hours than planned; 1.22 means 22% more.
Can machine learning forecast construction labor?
Yes, if you have history. A model trained on completed jobs learns how early labor performance translated into final hours for similar work, and forecasts a live job from its nearest past matches with a range. It should be back-tested on your own jobs before you rely on it.
How much history does a labor forecasting model need?
Dozens of completed jobs with weekly hours by cost code is enough to start, especially if they share sectors and trades. More history narrows the range; a model should always report how accurate it has been.
What is a labor productivity factor?
Earned hours divided by actual hours, where earned hours are installed quantity times the budgeted hours per unit. Below 1.0 means each hour is installing less than the estimate assumed.
How do you forecast labor hours to complete?
Multiply the remaining quantity by the actual hours per unit achieved so far (or a rate you have reason to expect), and add it to hours spent to date. Compare the total with the budgeted hours.
Related guides
More in Forecasting & cost
- Committed cost in construction: track buyout and the exposure still to buy
- Earned value management for construction, explained with one job
Free tools for this topic: Construction cost overrun calculator · Construction labor burden calculator · Construction markup vs margin calculator
All forecasting & cost resources →