- Track KPIs that move before the P&L does.
- Group them: is the work making money, is cash coming in, what is coming.
- Measure weekly and by job — averages hide the job that sinks the quarter.
- Watch trends, and make every number drill to its rows.
Is the work making money?
| KPI | Formula | A bad reading means |
|---|---|---|
| Gross margin (forecast) | (contract − forecast cost) ÷ contract | The job will earn less than it was sold at |
| Margin fade | margin now − margin at award | Forecasts were optimistic — the WIP number sureties watch |
| CPI | earned value ÷ actual cost | Each dollar spent buys less than a dollar of work |
| Labor productivity factor | actual hours ÷ earned hours | Crews are using more hours than the estimate allowed |
Is cash coming in?
| KPI | Formula | A bad reading means |
|---|---|---|
| Over/under billing | billed − earned | Under: you are financing the job |
| Days sales outstanding | AR ÷ revenue × days | Owners are paying slower |
| Retainage receivable | retainage held, by age | Completed work not turning into cash |
| Cash low point | lowest closing balance, 13 weeks | A squeeze is coming |
For more inputs, a second forecast and a shareable link: the overhead & break-even calculator →
What is coming?
| KPI | Formula | A bad reading means |
|---|---|---|
| Backlog | contract value not yet earned | Too little: overhead will outrun work |
| Unsigned work in place | cost coded to pending changes | Cost without revenue |
| Change orders % of contract | approved COs ÷ original contract | A scope or design problem, often early |
| Schedule slip | forecast finish − baseline finish | General conditions will overrun |
Using them well
- Measure weekly, by job — portfolio averages hide the one job that sinks the quarter.
- Watch the trend, not the level: a CPI falling from 0.98 to 0.92 matters more than a steady 0.95.
- Every KPI should drill to the rows behind it, or nobody will act on it.
The demo’s overview shows these on a sample eight-job portfolio, each one clickable down to the ledger. Whether to build them in Excel, Power BI or a construction intelligence platform is covered in construction dashboards and BI.
Setting thresholds that mean something
A KPI only helps if everyone agrees what reading triggers action. Set thresholds from your own completed jobs — what did the jobs that ended badly look like at 30% complete? — rather than industry averages, which mix trades, sizes and contract types. Common starting points, to tune against your own history:
| KPI | Watch | Act |
|---|---|---|
| CPI | below 0.97, or down two weeks running | below 0.93 |
| Margin fade | any fade since last month | more than 2 points since award |
| Labor productivity factor | above 1.05 | above 1.12 |
| Under-billing | any job under-billed two months running | more than 2% of contract value |
| Unsigned work in place | any change order pending over 30 days | over 60 days or over 1% of contract |
Thresholds are a starting point for a conversation, not a verdict. The value is that the conversation happens in week 8, not at the month-end close in week 14.
A 30-minute weekly KPI review
- Five minutes — what changed. Which jobs crossed a threshold since last week, in either direction.
- Ten minutes — the worst two jobs. For each: the forecast at completion, which cost type is driving it, and what the project manager is doing about it.
- Five minutes — cash. The 13-week low point, the largest past-due receivables, and anything to bill now.
- Five minutes — changes. Unsigned work in place, oldest first; who is chasing each one.
- Five minutes — decisions. Owners and dates for every action. Next week starts by checking them.
The review works when the numbers are ready before the meeting. If someone spends Monday morning rebuilding the spreadsheet, the meeting discusses the spreadsheet.
KPI mistakes that hide problems
- Percent complete from cost. If progress is cost to date ÷ budget, CPI is always 1.0 and fade appears only when the budget runs out. Measure progress from quantities or the schedule.
- Company averages. A portfolio CPI of 0.98 can be seven healthy jobs and one disaster.
- Margin on billings. Billing ahead of progress flatters margin until the job catches up with the invoices.
- Actual cost without commitments. Leaving out awarded subcontracts and open purchase orders understates cost at exactly the stage of a job when it matters.
- Too many KPIs. Thirty metrics on a dashboard means nobody owns any of them. Twelve, reviewed weekly, beats fifty reviewed never.
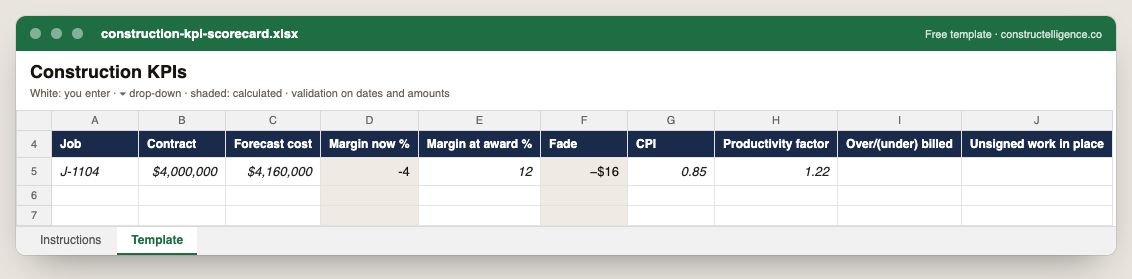
Per job: contract and forecast cost, margin now and at award with fade calculated, CPI, productivity factor, billing position and unsigned work in place.
10 columns: 8 you fill in and 2 calculated by formula and filled down 200 rows, so nothing is worked out by hand. In the Excel version, 7 columns reject entries of the wrong type (a date column only takes dates, an amount column only numbers), the header row stays frozen with filters on it, and the workbook opens on an Instructions sheet that lists every column below.
Every column, and how it is captured
| Column | Type | What goes in it |
|---|---|---|
| Job | Text | Job number exactly as in your accounting system (e.g. J-1104), so rows join to job cost. |
| Contract | Amount ($) | Contract value including approved change orders. |
| Forecast cost | Amount ($) | Enter the amount in dollars. |
| Margin now % | Calculated | Calculated: ([Contract] − [Forecast cost]) ÷ [Contract] × 100 |
| Margin at award % | Percent | Enter a percentage, 0–100. |
| Fade | Calculated | Calculated: [Margin now %] − [Margin at award %] |
| CPI | Number | Enter a number. |
| Productivity factor | Number | Enter a number. |
| Over/(under) billed | Amount ($) | Enter the amount in dollars. |
| Unsigned work in place | Amount ($) | Enter the amount in dollars. |
See it on real-looking numbers
Constructelligence is a construction intelligence platform: it reads your ERP, project and field systems read-only and does this arithmetic every week, for every job. The demo runs it on a sample eight-job portfolio.
Try the demoJoin the private betaFrequently asked questions
What are the most important KPIs for a construction company?
Forecast gross margin and fade, cost performance index, over/under billing, days sales outstanding, cash low point, backlog, labor productivity and unsigned change-order work. Together they show whether work is profitable, whether cash is coming in, and what is coming next.
What is margin fade in construction?
Fade is the drop in a job's forecast gross margin from when it was awarded to now. Sureties and lenders watch it closely because it shows whether a contractor's forecasts are realistic.
How is days sales outstanding calculated for a contractor?
Accounts receivable divided by revenue for the period, multiplied by the number of days in the period. Many contractors track it with and without retainage.
How often should construction KPIs be reviewed?
Weekly for job-level KPIs such as CPI, labor productivity and billing position, and at least monthly for company-level measures such as backlog and DSO.
What is a good CPI for a construction project?
1.0 or above means the work is costing no more than budgeted. Most contractors start watching a job below about 0.97 and act below about 0.93, but the right thresholds come from your own completed jobs — what the ones that finished badly looked like part-way through.
Related guides
More in Running the business
- Change order management: stop carrying work nobody has signed for
- Subcontractor bid leveling: find the real low bid
Free tools for this topic: Change order pricing calculator · Contractor overhead recovery and break-even calculator · Construction markup vs margin calculator
All running the business resources →