- Cash and profit run on different clocks — forecast cash on its own.
- Use 13 weeks, and date receipts by each owner’s real payment history.
- The lowest closing balance, and its week, is the number that matters.
- Under-billing, retainage and unsigned changes are the usual cash leaks.
Why profit and cash diverge
- Timing: you pay crews weekly and suppliers in 30 days; the owner pays your application in 30–60.
- Retainage: 5–10% of every billing is held until completion.
- Under-billing: work in place you have not invoiced is cash you have spent and not asked for.
- Unsigned changes: cost goes out long before the revenue is approved.
The 13-week model
Thirteen weeks — a quarter — is long enough to see a problem coming and short enough to forecast honestly. For each week:
- Cash in: each job’s pay applications, dated by the owner’s real payment history (not the contract terms), less retainage.
- Cash out: payroll every week; AP by due date; subcontractor payments by their terms (often pay-when-paid); overhead, debt service, taxes.
The number that matters is the lowest closing balance and the week it happens.
A worked 13-week example
A contractor with $1.8M in the bank, weekly payroll of $180,000, subcontractor and supplier runs every fourth week, and six pay applications due to be paid over the quarter. Selected weeks shown; figures are illustrative.
| Week | Cash in | Cash out | Closing |
|---|---|---|---|
| 1 | — | $220,000 | $1,580,000 |
| 2 | $620,000 | $275,000 | $1,925,000 |
| 4 | — | $595,000 | $1,110,000 |
| 8 | — | $595,000 | $590,000 |
| 10 | — | $275,000 | $635,000 |
| 12 | — | $595,000 | $520,000 |
| 13 | $450,000 | $220,000 | $750,000 |
Every month-end in this quarter looks comfortable. The low point — $520,000 in week 12 — sits between month-ends, the week a sub-and-supplier run lands before the next receipt. Now move one receipt: the $540,000 due in week 9 arrives two weeks late, because that owner actually pays at 60 days, not the 45 in the contract. The low point drops to $95,000 in week 10. One owner’s habits, not the business’s profitability, decide whether payroll is tight.
That is why receipts are dated by payment history and why the forecast is weekly. The receipts themselves come from the pay application schedule less retainage; the pay application and retainage calculator works out what each one will actually pay.
For more inputs, a second forecast and a shareable link: the over/under billing calculator →
What to do before the low point
- Bill under-billed work on the next application.
- Chase receivables past 60 days, oldest and largest first.
- Get unsigned change orders signed — then bill them.
- Negotiate retainage release or reduction on jobs past 50%.
- Align subcontractor payment terms with your own receipts where contracts allow.
- Line up credit before you need it — banks lend to forecasts, not emergencies.
Six mistakes that make cash forecasts wrong
- Using contract payment terms. Owners pay on their own clock. Use the average days-to-pay from each owner’s history, and the slowest recent payment as a stress case.
- Forecasting billings instead of receipts. A pay application is not cash until it clears. Forecast the receipt date and the net amount after retainage.
- Forgetting retainage timing. Retainage comes back after substantial completion and closeout — often months later. Put it in the week you realistically expect it, or leave it out.
- Monthly buckets. Payroll is weekly and the squeeze happens between month-ends, as the example shows.
- Ignoring committed cost. Awarded subcontracts and open purchase orders are cash out that has not been invoiced yet. Leave them out and the forecast is optimistic by exactly the amount that hurts.
- Never checking the forecast against what happened. Compare last week’s forecast with actual receipts and payments every Monday. The gaps show which owners, subs and assumptions to correct.
Cash by job, not just in total
A company-level forecast says when cash gets tight; a job-level one says which job is consuming it. Jobs that are under-billed, carrying unsigned changes, or front-loaded with subcontractor payments usually show up as negative cash positions long before they show up as losses. Ranking jobs by their own cash position each week tells project managers where to bill, chase or negotiate first — and it ties the cash forecast to the WIP schedule the bank and surety already read.
Keeping it live
A cash forecast rebuilt monthly in a spreadsheet is stale in a week. Built from the billing schedule, AR aging, payroll and committed costs you already have, it updates itself. The cash-flow view in the demo shows the portfolio low point and which jobs go negative.
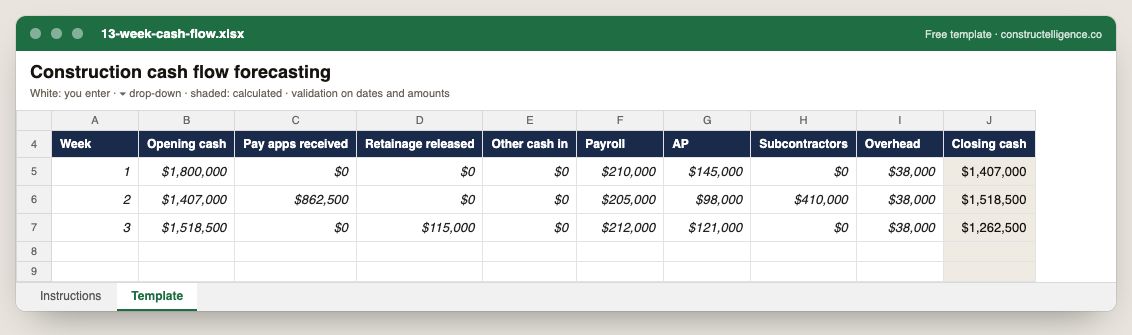
Thirteen weeks of cash: opening balance carried from the week before, pay applications, retainage and other receipts in, payroll, AP, subcontractors and overhead out, and closing cash calculated.
10 columns: 9 you fill in and 1 calculated by formula and filled down 200 rows, so nothing is worked out by hand. In the Excel version, 9 columns reject entries of the wrong type (a date column only takes dates, an amount column only numbers), the header row stays frozen with filters on it, and the workbook opens on an Instructions sheet that lists every column below.
Every column, and how it is captured
| Column | Type | What goes in it |
|---|---|---|
| Week | Number | Week-ending date. |
| Opening cash | Amount ($) | Enter the amount in dollars. First row: enter it. Every later row is calculated: [Closing cash]. |
| Pay apps received | Amount ($) | Enter the amount in dollars. |
| Retainage released | Amount ($) | Enter the amount in dollars. |
| Other cash in | Amount ($) | Enter the amount in dollars. |
| Payroll | Amount ($) | Enter the amount in dollars. |
| AP | Amount ($) | Enter the amount in dollars. |
| Subcontractors | Amount ($) | Enter the amount in dollars. |
| Overhead | Amount ($) | Enter the amount in dollars. |
| Closing cash | Calculated | Calculated — opening cash plus receipts minus payments (= [Opening cash] + [Pay apps received] + [Retainage released] + [Other cash in] − [Payroll] − [AP] − [Subcontractors] − [Overhead]) |
See it on real-looking numbers
Constructelligence is a construction intelligence platform: it reads your ERP, project and field systems read-only and does this arithmetic every week, for every job. The demo runs it on a sample eight-job portfolio.
Try the demoJoin the private betaFrequently asked questions
What is a 13-week cash flow forecast?
A week-by-week projection of cash in and cash out over the next quarter, starting from today's balance. It shows the lowest cash balance and when it occurs, early enough to act.
Why do profitable contractors run out of cash?
Because costs are paid weeks before owners pay progress billings, retainage is withheld until completion, and under-billed or unapproved work is cash spent that has not been billed.
How do you forecast when an owner will pay?
Use each owner's actual payment history — average days from pay application to payment — rather than the contractual terms, which are often optimistic.
How often should a construction cash flow forecast be updated?
Weekly. Payroll, receipts and payables move every week, and the value of the forecast is seeing the low point before it arrives.
Should retainage be included in a cash flow forecast?
Only in the week it is realistically expected — usually after substantial completion, the punch list and closeout documents. Treating retainage as part of each progress receipt overstates cash in every week of the job.
What is the difference between a cash flow forecast and a WIP schedule?
The WIP schedule compares earned revenue with billings to show over- and under-billing on each job; the cash flow forecast turns billings, payment timing, payroll and payables into a week-by-week bank balance. Under-billing on the WIP is one of the main reasons the cash forecast dips.
Related guides
More in Billing & cash
- The schedule of values: how to build one, bill against it and avoid front-loading
- Construction invoice template: what to put on it, a filled-in example, and a free download
- AIA G702 and G703: filling out a pay application, line by line
- Lien waivers in construction: the four types, when to sign each, and how to track them
Free tools for this topic: Over/under billing calculator (WIP) · Pay application and retainage calculator · G703 continuation sheet PDF to Excel
All billing & cash resources →