- A construction dashboard needs job-level forecast, committed cost and billing position — not just cost to date.
- Excel, Power BI and construction intelligence differ most in upkeep, not charts.
- The construction data model is the hard part.
- Budget maintenance time before comparing licence prices.
What a construction dashboard needs to show
- Per job: contract, budget, cost to date, committed cost, forecast at completion, variance, percent complete, billed, over/under billing.
- Portfolio: backlog, gross margin and fade, cash position, AR aging with retainage, overtime.
- Warnings: jobs trending over, unapproved changes in place, billing behind cost.
The construction KPIs guide has the formulas.
Three routes compared
| Excel pack | Power BI / generic BI | Construction intelligence | |
|---|---|---|---|
| Set-up | Days | Weeks to months — the data model is the project | Days — the construction model is built in |
| Freshness | Monthly, when rebuilt | As often as the refresh runs | As cost posts |
| Forecasts | Formulas someone maintains | DAX someone maintains | EAC, WIP and cash forecasts included |
| Upkeep | Rebuilt every month | A specialist, forever | The vendor |
| Flexibility | Total | High | Construction questions; exports to BI for the rest |
They are not exclusive. Plenty of contractors run a construction intelligence layer and still point Power BI at its tables for board reporting.
Why construction data is hard to model
- Cost codes and cost types differ by company, and by year in the same company.
- Committed cost lives in subcontracts and POs, not in the ledger, until it is invoiced.
- Percent complete has to come from somewhere other than cost, or every forecast is circular.
- Change orders exist in several states — pending, approved, in place unsigned — often in two systems.
- Several companies with different charts of accounts need one view.
Each is solvable. Together they are why a generic BI project stalls at month three.
Most of that modelling is easier against a SQL copy of the ERP with a layer of views in front, rather than against the ERP itself — see setting up a construction reporting database.
The real cost: maintenance
A dashboard is a product, not a project. Someone must fix it when a cost code is added, a company is acquired or a report changes. Budget that time honestly — the calculator below does — before comparing licence prices.
Who owns each number, and how often it refreshes
Dashboards fail less on charts than on trust: two reports showing different numbers for the same job. Give every measure one owning system and a refresh cadence, and print both on the dashboard.
| Measure | Owning system | Refresh |
|---|---|---|
| Cost to date, committed cost | Accounting / ERP | Daily |
| Contract value, approved changes | Accounting / ERP | Daily |
| Pending changes, RFIs | Project management platform | Daily |
| Hours by cost code | Payroll / time tracking | Weekly (payroll close) |
| Forecast at completion | Computed from the above | Weekly |
When a number in a meeting is challenged, the answer is the owning system's figure and its refresh time — not a debate about spreadsheets. The KPIs guide covers which measures to show; the tech stack guide covers how the systems connect.
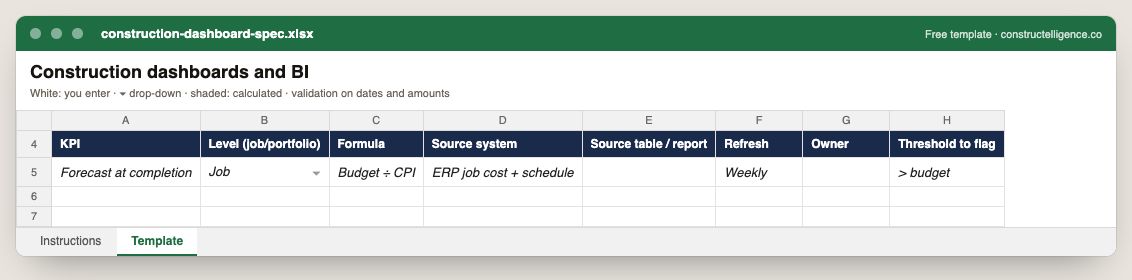
Each KPI on the dashboard with its level, formula, source system and table, refresh frequency, owner and the threshold that flags it.
8 columns: 7 you fill in and 1 picked from drop-down lists, so every row uses the same values. In the Excel version, the header row stays frozen with filters on it, and the workbook opens on an Instructions sheet that lists every column below.
Every column, and how it is captured
| Column | Type | What goes in it |
|---|---|---|
| KPI | Text | Free text. |
| Level (job/portfolio) | Drop-down | Options: job / portfolio. |
| Formula | Text | Free text. |
| Source system | Text | Free text. |
| Source table / report | Text | Free text. |
| Refresh | Text | Free text. |
| Owner | Text | The person responsible for the row. |
| Threshold to flag | Text | Free text. |
See it on real-looking numbers
Constructelligence is a construction intelligence platform: it reads your ERP, project and field systems read-only and does this arithmetic every week, for every job. The demo runs it on a sample eight-job portfolio.
Try the demoJoin the private betaFrequently asked questions
What is the best dashboard software for construction companies?
Excel suits a small firm with one person who owns the monthly pack. Power BI suits firms with a data specialist who can build and maintain a construction data model. Construction intelligence platforms such as Constructelligence come with the construction model, forecasts and WIP built in, and can still feed Power BI.
Can Power BI be used for construction?
Yes. Power BI can connect to most construction ERPs and PM platforms. The work is in modelling job cost, committed cost, change orders and percent complete correctly, and in maintaining that model as codes and companies change.
What should be on a construction dashboard?
For each job: contract, budget, cost to date, committed cost, forecast at completion, variance, percent complete and over/under billing. For the company: backlog, margin and fade, cash, AR aging with retainage and overtime — plus warnings for jobs trending over.
How often should construction dashboards update?
As often as cost posts — daily or weekly. A monthly dashboard reports overruns after the month in which they could have been caught.
Why do construction dashboards show different numbers from accounting?
Usually because they were refreshed at different times or pull the same measure from different systems. Give each measure one owning system and show its refresh time on the dashboard.
Related guides
More in Construction software & tech
- The best construction management software in 2026: 12 platforms compared, and how to choose
- Construction accounting software and ERP: the main systems and how to choose
- Construction estimating software: takeoff and bid tools compared
- Construction scheduling software: Primavera P6, Microsoft Project and the rest
- Construction technology trends in 2026: what is actually changing
- Sage 300 CRE reporting: job cost, WIP and dashboards without rebuilding Excel
- QuickBooks job costing for contractors: setup, reports and when you outgrow it
Free tools for this topic: Construction PDF to Excel converter · Schedule PDF to Excel (P6 & MS Project) · Construction schedule health check
All construction software & tech resources →