- Rates use cases × 200,000 ÷ hours worked.
- TRIR counts all recordables; DART and LTIR count the more serious ones.
- EMR multiplies workers' comp premium — a 0.35 swing can be six figures a year.
- Track leading indicators by job and sub; they move before the rates do.
Incident rates on the 200,000-hour basis
OSHA incident rates normalize injury counts to 200,000 hours — 100 full-time workers for a year — so a small contractor and a large one can be compared.
- TRIR (total recordable incident rate) — all OSHA-recordable cases.
- DART — cases with days away, restricted duty or job transfer.
- LTIR (lost-time incident rate) — cases with days away from work.
A worked example
A contractor's crews worked 612,000 hours in the year, with 5 recordable cases; 2 involved restricted duty or days away, and 1 involved days away from work.
Report the hours alongside the rates: on a small hours base, a single case moves the rate a long way, which is why owners often ask for three years.
The experience modification rate and what it costs
The EMR compares a contractor's actual workers' compensation losses with the losses expected for its payroll and trade classes; 1.0 is average, below 1.0 is better. It multiplies the workers' compensation premium — and many owners set a maximum EMR to bid.
The EMR usually looks back over three policy years (excluding the most recent), so today's injuries raise premiums for years — which puts a real number on prevention when you compare it with the other KPIs in an overhead budget.
Leading indicators
Rates and EMR are lagging: they report injuries after they happen. Leading indicators move first:
- Observations and near-miss reports per 100 workers, and the share closed within a week.
- Pre-task plans completed before work starts.
- Toolbox talks and training completed against plan.
- Repeat findings on inspections — the same hazard in the same area.
Track them by job and by subcontractor, the way cost is tracked — the same reporting stack does both (see construction dashboards). Computer-vision tools can add observations from site cameras; the AI for safety guide covers what they do and do not catch.
Getting the hours right
Every rate on this page divides by hours worked, and the denominator is where most miscalculated rates go wrong:
- Actual hours worked by your own employees, from payroll — including overtime, excluding vacation, sick leave and holidays.
- Not budgeted or scheduled hours. A crew that ran short all year had a higher rate than the plan implies.
- Your employees, not your subcontractors'. Track subcontractor rates separately if you want them; mixing their injuries or hours into your own rate makes it meaningless to compare.
- The same period for cases and hours — a calendar year, or a rolling twelve months, but never cases from one and hours from the other.
Pull the hours from the same payroll data that feeds labor forecasting, so safety and cost reports agree on how much work was done.
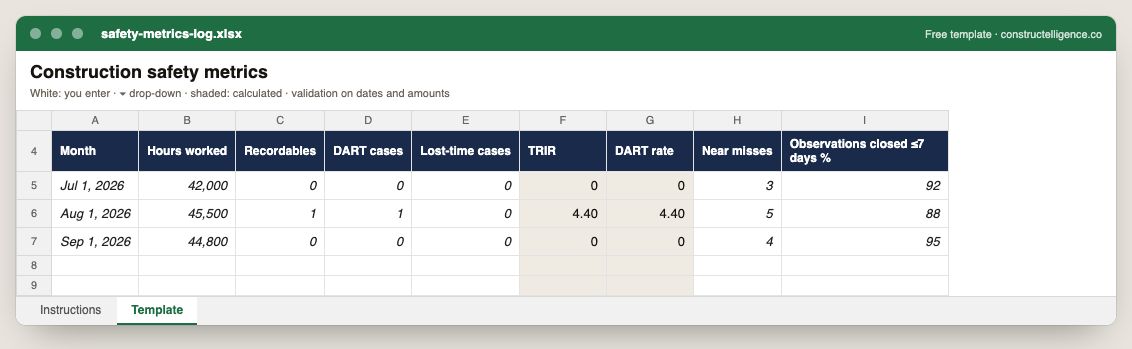
Monthly hours worked, recordables, DART and lost-time cases and near misses, with TRIR and DART rate calculated, and the share of observations closed within seven days.
9 columns: 7 you fill in and 2 calculated by formula and filled down 200 rows, so nothing is worked out by hand. In the Excel version, 7 columns reject entries of the wrong type (a date column only takes dates, an amount column only numbers), the header row stays frozen with filters on it, and the workbook opens on an Instructions sheet that lists every column below.
Every column, and how it is captured
| Column | Type | What goes in it |
|---|---|---|
| Month | Date | Enter the date. |
| Hours worked | Number | Enter a number. |
| Recordables | Number | Enter a number. |
| DART cases | Number | Enter a number. |
| Lost-time cases | Number | Enter a number. |
| TRIR | Calculated | Calculated: [Recordables] × 200000 ÷ [Hours worked] |
| DART rate | Calculated | Calculated: [DART cases] × 200000 ÷ [Hours worked] |
| Near misses | Number | Enter a number. |
| Observations closed ≤7 days % | Percent | Enter a percentage, 0–100. |
See it on real-looking numbers
Constructelligence is a construction intelligence platform: it reads your ERP, project and field systems read-only and does this arithmetic every week, for every job. The demo runs it on a sample eight-job portfolio.
Try the demoJoin the private betaFrequently asked questions
How do you calculate TRIR in construction?
Multiply the number of OSHA-recordable cases by 200,000 and divide by total hours worked in the period. For example, 5 recordables in 612,000 hours is a TRIR of about 1.63.
What is the difference between TRIR and DART?
TRIR counts all recordable cases; DART counts only the recordable cases that led to days away from work, restricted duty or a job transfer. Both use the same 200,000-hour basis.
What is a good EMR for a contractor?
An EMR of 1.0 is average for the trade and payroll; below 1.0 means fewer losses than expected. Many owners and general contractors set a maximum EMR — often around 1.0 — for bidders.
Why is the 200,000-hour basis used?
It equals 100 full-time employees working 40 hours a week for 50 weeks, which normalizes injury counts so companies of different sizes can be compared.
What hours go into the TRIR calculation?
Actual hours worked by your own employees in the period, from payroll, including overtime and excluding paid leave such as vacation, sick time and holidays.
Do subcontractor injuries count in my TRIR?
Generally no: each employer records injuries to its own employees. The main exception is temporary workers you supervise day to day, whom you record. Track subcontractor safety performance separately.
Related guides
More in Scheduling & field
- The critical path method in construction, worked through one schedule
- The three-week look-ahead schedule: build it, run it, measure it